
COT dashboard › Weekly reports › 20 Oct 2026
COT REPORT · 20 OCT 2026
CFTC Commitments of Traders, NQ & ES futures positioning, positions as of 20 Oct 2026NQ dealers net short 94,122 contracts
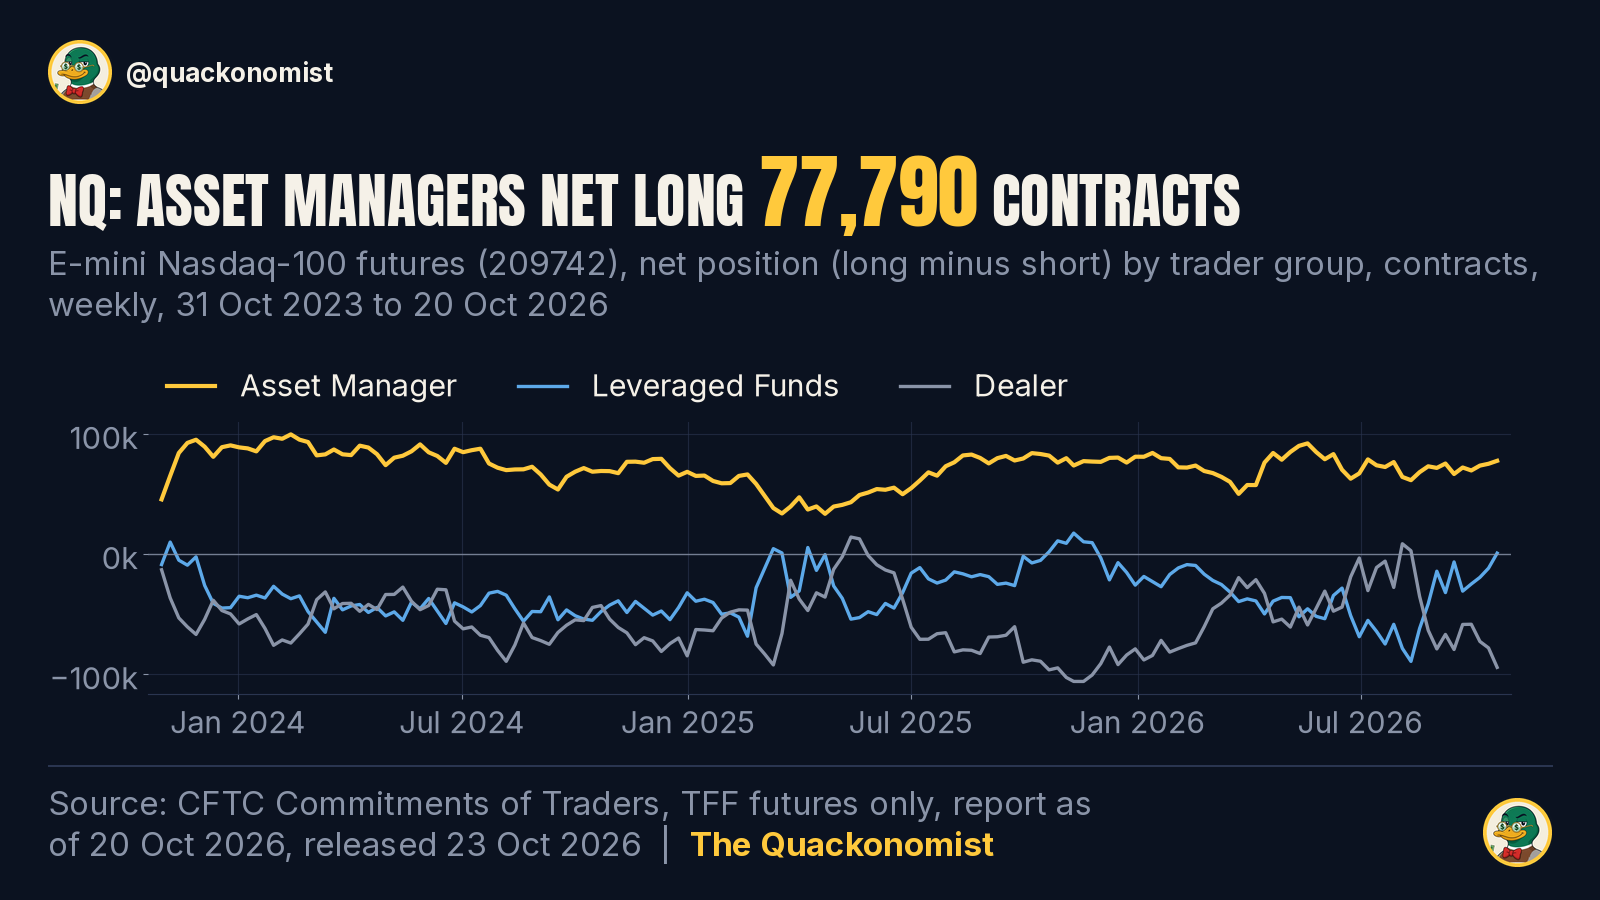
Positions at the close of business on Tuesday 20 Oct 2026, published by the CFTC on 23 Oct 2026 (15:30 ET). NQ dealers' net position is at the 4th percentile of the last 156 weekly reports, the furthest from the middle of its 3-year range among the NQ and ES groups. Changes below compare with the previous weekly report.
E-mini Nasdaq-100 NQ
CFTC code 209742 · NASDAQ 100 STOCK INDEX X $20 · net position = long minus short, contracts
| Group | Long | Short | Net | Net prev. | Net chg | Long chg | Short chg | 1y pct | 3y pct |
|---|---|---|---|---|---|---|---|---|---|
| Asset Manager | 109,985 | 32,195 | 77,790 | 75,323 | +2,467 | −2,619 | −5,086 | 67th | 60th |
| Leveraged Funds | 51,749 | 50,799 | 950 | −11,593 | +12,543 | +3,643 | −8,900 | 90th | 94th |
| Dealer | 38,475 | 132,597 | −94,122 | −77,932 | −16,190 | −10,100 | +6,090 | 12th | 4th |
Open interest: 272,462 contracts (−7,053 vs the 13 Oct 2026 report).
What the data shows
- Asset managers were net long 77,790 contracts, the highest net position since the 7 Jul 2026 report, 15 weeks earlier; that is the 60th percentile of the last 156 weekly reports.
- Leveraged funds were net long 950 contracts, the highest net position since the 25 Nov 2025 report, 47 weeks earlier; that is the 94th percentile of the last 156 weekly reports. The previous week they were net short 11,593.
- Dealers were net short 94,122 contracts, the lowest net position since the 25 Nov 2025 report, 47 weeks earlier; that is the 4th percentile of the last 156 weekly reports.
- The largest week-over-week change of the three groups was in dealers: their net position fell by 16,190 contracts.
E-mini S&P 500 ES
CFTC code 13874A · $50 X S&P 500 INDEX · net position = long minus short, contracts
| Group | Long | Short | Net | Net prev. | Net chg | Long chg | Short chg | 1y pct | 3y pct |
|---|---|---|---|---|---|---|---|---|---|
| Asset Manager | 1,101,642 | 200,265 | 901,377 | 915,835 | −14,458 | −8,742 | +5,716 | 12th | 30th |
| Leveraged Funds | 135,034 | 506,279 | −371,245 | −408,726 | +37,481 | +13,630 | −23,851 | 62nd | 36th |
| Dealer | 184,740 | 821,671 | −636,931 | −602,358 | −34,573 | −16,220 | +18,353 | 83rd | 69th |
Open interest: 1,935,470 contracts (+3,863 vs the 13 Oct 2026 report).
What the data shows
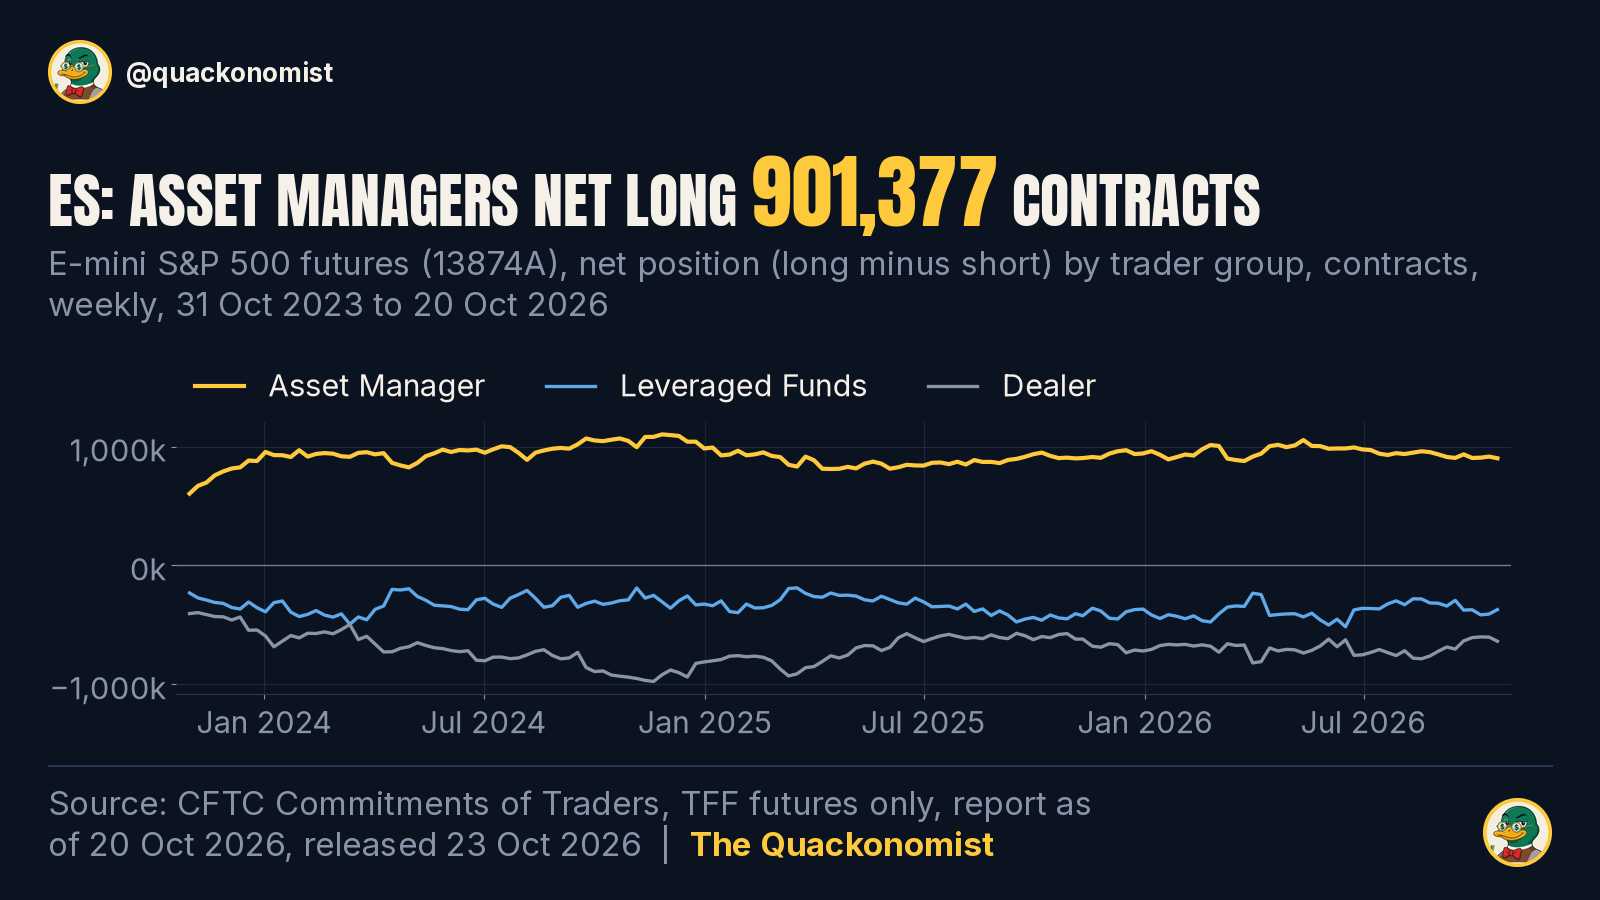
- Asset managers were net long 901,377 contracts, the lowest net position since the 24 Mar 2026 report, 30 weeks earlier; that is the 30th percentile of the last 156 weekly reports.
- Leveraged funds were net short 371,245 contracts, the 62nd percentile of the last 52 weekly reports and the 36th percentile of the last 156.
- Dealers were net short 636,931 contracts, the 83rd percentile of the last 52 weekly reports and the 69th percentile of the last 156.
- The largest week-over-week change of the three groups was in leveraged funds: their net position rose by 37,481 contracts.
Micro contracts
Separate CFTC rows. Micro contracts are one tenth of the E-mini size, so contract counts are not directly comparable with NQ and ES.
Micro E-mini Nasdaq-100 MNQ
CFTC code 209747 · NASDAQ 100 STOCK INDEX x $2 · net position = long minus short, contracts
| Group | Long | Short | Net | Net prev. | Net chg | Long chg | Short chg | 1y pct | 3y pct |
|---|---|---|---|---|---|---|---|---|---|
| Asset Manager | 10,247 | 479 | 9,768 | 10,790 | −1,022 | −764 | +258 | 60th | 87th |
| Leveraged Funds | 8,979 | 95,360 | −86,381 | −102,978 | +16,597 | −1,116 | −17,713 | 52nd | 24th |
| Dealer | 54,296 | 12,488 | 41,808 | 41,250 | +558 | +4,210 | +3,652 | 33rd | 73rd |
Open interest: 134,202 contracts (−18,403 vs the 13 Oct 2026 report).
What the data shows
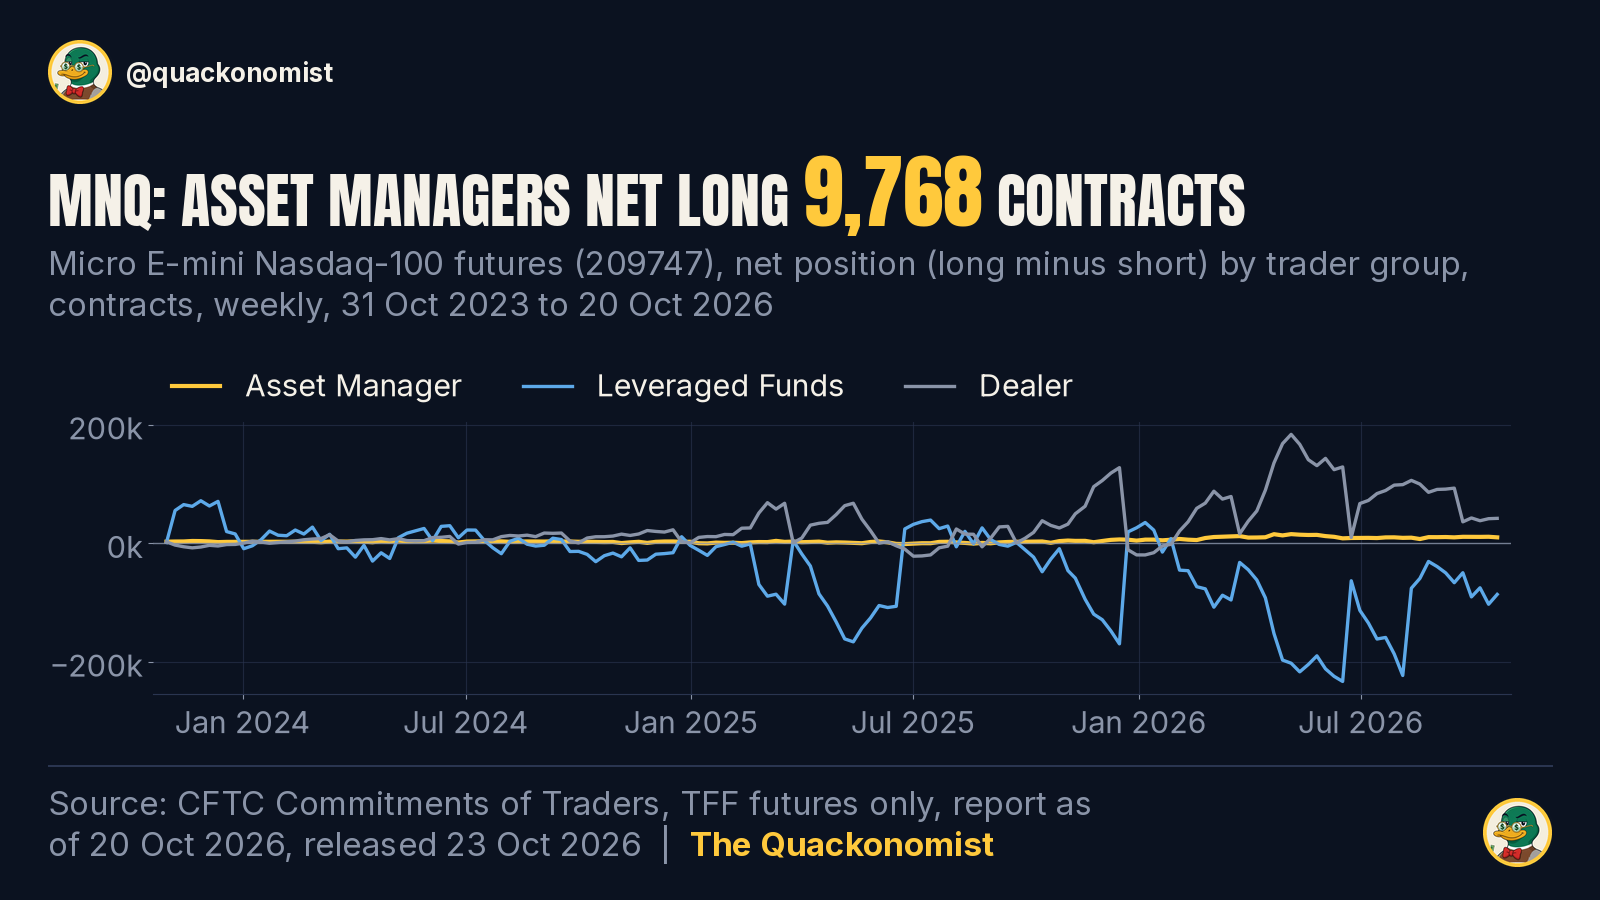
- Asset managers were net long 9,768 contracts, the 60th percentile of the last 52 weekly reports and the 87th percentile of the last 156.
- Leveraged funds were net short 86,381 contracts, the 52nd percentile of the last 52 weekly reports and the 24th percentile of the last 156.
- Dealers were net long 41,808 contracts, the 33rd percentile of the last 52 weekly reports and the 73rd percentile of the last 156.
- The largest week-over-week change of the three groups was in leveraged funds: their net position rose by 16,597 contracts.
Micro E-mini S&P 500 MES
CFTC code 13874U · $5 X S&P 500 INDEX · net position = long minus short, contracts
| Group | Long | Short | Net | Net prev. | Net chg | Long chg | Short chg | 1y pct | 3y pct |
|---|---|---|---|---|---|---|---|---|---|
| Asset Manager | 26,616 | 196 | 26,420 | 22,625 | +3,795 | +3,893 | +98 | 69th | 79th |
| Leveraged Funds | 76,560 | 92,807 | −16,247 | −17,918 | +1,671 | +19,394 | +17,723 | 50th | 36th |
| Dealer | 6,862 | 15,454 | −8,592 | −8,063 | −529 | +3,586 | +4,115 | 19th | 15th |
Open interest: 194,990 contracts (+30,500 vs the 13 Oct 2026 report).
What the data shows
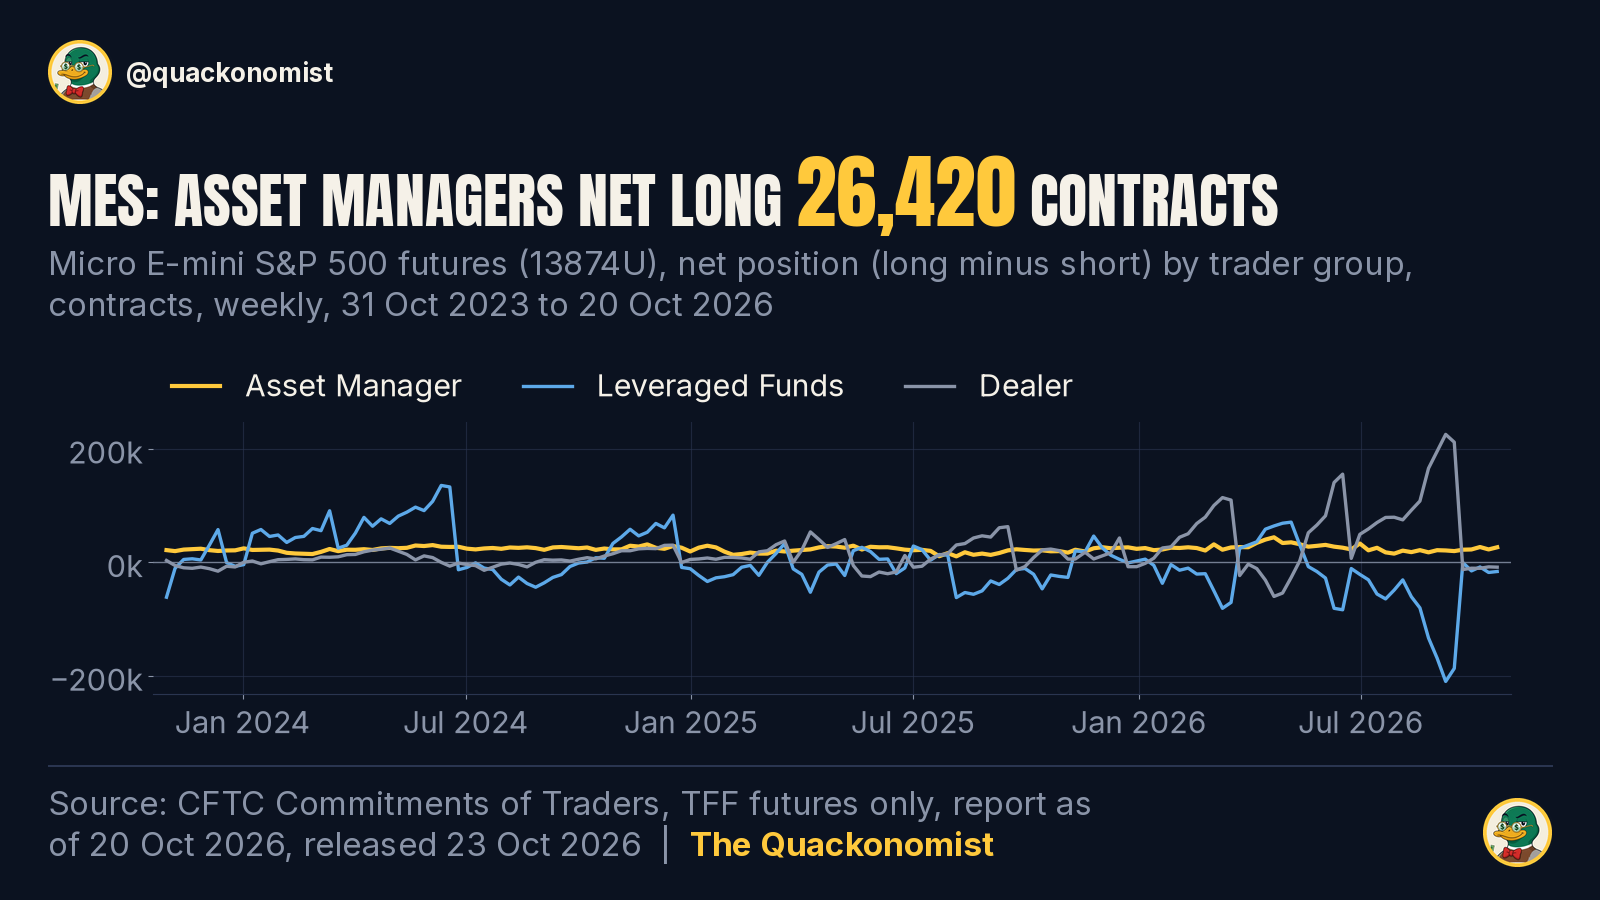
- Asset managers were net long 26,420 contracts, the 69th percentile of the last 52 weekly reports and the 79th percentile of the last 156.
- Leveraged funds were net short 16,247 contracts, the 50th percentile of the last 52 weekly reports and the 36th percentile of the last 156.
- Dealers were net short 8,592 contracts, the 19th percentile of the last 52 weekly reports and the 15th percentile of the last 156.
- The largest week-over-week change of the three groups was in asset managers: their net position rose by 3,795 contracts.
Source: CFTC Commitments of Traders, Traders in Financial Futures, futures only, report as of 20 Oct 2026, released 23 Oct 2026. Net = long minus short; percentile = share of the last 52 / 156 weekly net positions at or below this week's. Method · This week's data (JSON)
Disclaimer
Author: The Quackonomist (pseudonym). Publisher: Momentum Finance s. r. o., Ladislava Hudeca 15326/2A, 974 01 Banská Bystrica, Slovakia, IČO 55328067, Commercial Register of the District Court Banská Bystrica, Section Sro, File No. 45986/S; contact: privateequitystock@gmail.com. Data as of: 20 Oct 2026 (positions at close of business, Tuesday); CFTC release 23 Oct 2026, 15:30 ET / 21:30 CEST. Sources: CFTC Commitments of Traders (Traders in Financial Futures, futures only), via publicreporting.cftc.gov; data may be delayed or contain errors.
This page is general market commentary for information and education only. It is not intended as investment advice, an investment recommendation or a suggested investment strategy under Regulation (EU) No 596/2014 (MAR), and it does not consider anyone's personal circumstances. Nothing here is an offer or solicitation to buy or sell any financial instrument or crypto-asset.
Facts are sourced; opinions are clearly labelled. Price levels are reference points (e.g. prior highs/lows, moving averages), not forecasts, targets or signals. Trading futures, FX and crypto-assets carries a high risk of loss; past performance is not a reliable indicator of future results.
Conflicts: The author trades for their own account and may hold long or short positions in instruments discussed, before or after publication. Positions are not disclosed and may change at any time. The Quackonomist receives no payment from any issuer mentioned.